To monitor the functioning of the Scheldt Estuary, a standardized methodology for evaluation was developed by both Flanders and The Netherlands. This evaluation is performed on the whole estuary for a six year period, and is coordinated by the working group Research and Monitoring of the Vlaams-Nederlandse Scheldecommissie (VNSC). There have been three installments of these evaluations published, for the periods 2004-2009, 2010-2015 and 2016-2021.
In december '23 werd de nieuwe versie van de zesjaarlijkse evaluatie van de Schelde gepubliceerd. Het volledige rapport is te vinden op deze website.
De ruwe data uit het rapport kunnen bekeken worden via de RShiny-applicaties van ScheldeMonitor. Probeer het zelf in het iframe hieronder, of bezoek het overzicht van al onze applicaties.
T2021
By the end of 2023, the new version of the T-evaluation was published. This evaluation focuses on the detected shifts in the estuary for 2016-2021, and translates these shifts to an evaluation per main function of the Scheldt River. A detailed evaluation report is published, alongside an analyses report with calculations, a policy report, an update of the methodology and a data overview.
T2015
The next evaluation was performed for the year 2015. This resulted in an analysis and evaluation report in 2018, as well as a summarizing report.
All documents are only available in Dutch.
T2009
To correctly evaluate the main functions of the estuary in the long term, a uniform baseline needed to be set. Therefore, 2009 was chosen as the first year to perform the evaluation, and to hold this as a reference for the future. This evaluation resulted in an analysis report in which the baseline and developments before 2009 were defined. Additionally, an evaluation report was deliverd as well on the methodology used. This evaluation report received its own evaluation in a document in 2013, and was updated in 2014.
All documents are only available in Dutch.
Indicators voor sustainable management
Flanders and The Netherlands have cooperated to develop a methodology to evaluate the functioning of the Scheldt Estuary and the activities that are held within. This methodology, which is applied every six years, was asked for by the Research and Monitoring Working Group of the Flemish-Dutch Scheldt Commission (VNSC). The evaluation has already been done twice, for 2009 and 2015, and is pending for 2021.
Methodology
The methodology used in these reports focuses on three main functions: Accessibility, Safety and Sustainability. These functions are addressed through seven different indicators. Every indicator is built up by a pyramide strucuture of the relevant parameters needed. The pyramide structure below serves as an example, but is only available in Dutch:
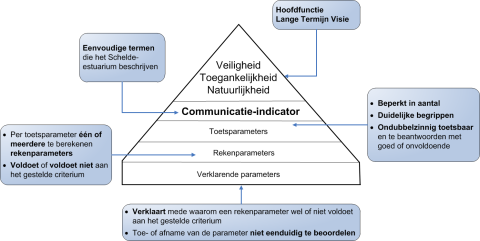
Pyramides of the indicators
The table below provides an overview of how the indicators were built up in pyramides through the different versions of T-reports. This overview, as well as the technical files inside, is only available in Dutch:
| INDICATOR | PYRAMIDE | |
|---|---|---|
| VEILIGHEID | Dynamiek waterbeweging | versie T2009 versie 2014 versie T2015 |
| TOEGANKELIJKHEID | Bevaarbaarheid | versie T2009 versie 2014 versie T2015 |
| NATUURLIJKHEID | Waterkwaliteit | versie T2009 versie 2014 versie T2015 |
| Flora & Fauna | versie T2009 versie 2014 versie T2015 |
|
| Ecologisch functioneren | versie T2009 versie 2014 versie T2015 |
|
| Leefomgeving | versie T2009 versie 2014 versie T2015 |
|
| Plaat- geulsysteem | versie T2009 |